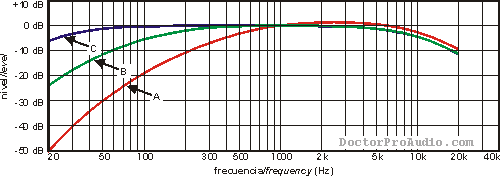
The B weighting is used for intermediate levels and is similar to A, except for the fact that low frequency attenuation is a lot less extreme, though still significant (-10 dB a 60 Hz). Recent studies show this is the best weighting to use for musical listening purposes.
The C weighting is similar to B and A as far as the high frequencies are concerned. In the low frequency range it hardly provides attenuation. This weighting is used for high level noise. The different weightings can be graphically compared on the graph above.
These weightings are not very accurate for two reasons. Firstly, they are based on the inverse of the Fletcher & Munson contours, which are old and provide substantial error, since they were measured with the limited instrumentation of the time. Secondly, the curves are simple and do not include significant inflexions happening in the mid-range (around 3500 Hz) as well as the high frequencies. This last reason is due to the fact that the weightings were designed around practical -and hence very simple- electrical circuits for the time. For those reasons the weightings are not all that accurate as they do not reflect the exact behaviour of the ear, although they do provide basic attenuation in the low and high frequencies that approximately simulates the varying responses of the ear at different levels. Nowadays it would be possible to define new weightings based on more exact loudness contours, and they could take more complex shapes that reflected ear responses more accurately and be easily realizable with current electronics. However, decades of use of the classic standard weightings seem to be an obstacle when it comes to standardizing a new set of more exact weighting curve.
Measurements taken using the aforementioned weightings are denoted by writing the weighting letter in parenthesis after "dB". Thus we speak of dB (A), dB (B) or dB (C). There exist other weightings for special applications such as D, for very high pressure aeronautical noise.
On a sound level meter (SLM) we should select weighting B for measuring loudspeaker enclosures in the listening area. If B is not available and we are forced to choose between A and C, we should pick C. If only A is available, we should use not weighting. If, for environmental reasons, we are after the lowest possible sound pressure reading, we should choose A, since it is the weighting that provides the most attenuation.

In recent years the B-weighting has been phased out from sound pressure meters (and from the 2003 edition of IEC 61672) and the 'linear' ('unweighted') position has been replaced by the Z-weighting, which is the same except that the minimum frequency band in which the response must be flat (10Hz to 20kHz, ±1.5 dB) is specified.
In telecommunication, the term 'psophometric weighting' is used, and the CCITT and 'C-Message' curves, which are more extreme in terms of attenuation of highs and lows than the C-weighting, are utilized.
Related reading »» Fletcher-Munson equal loudness contours


 In-Depth
 Sections menu
 News
News